
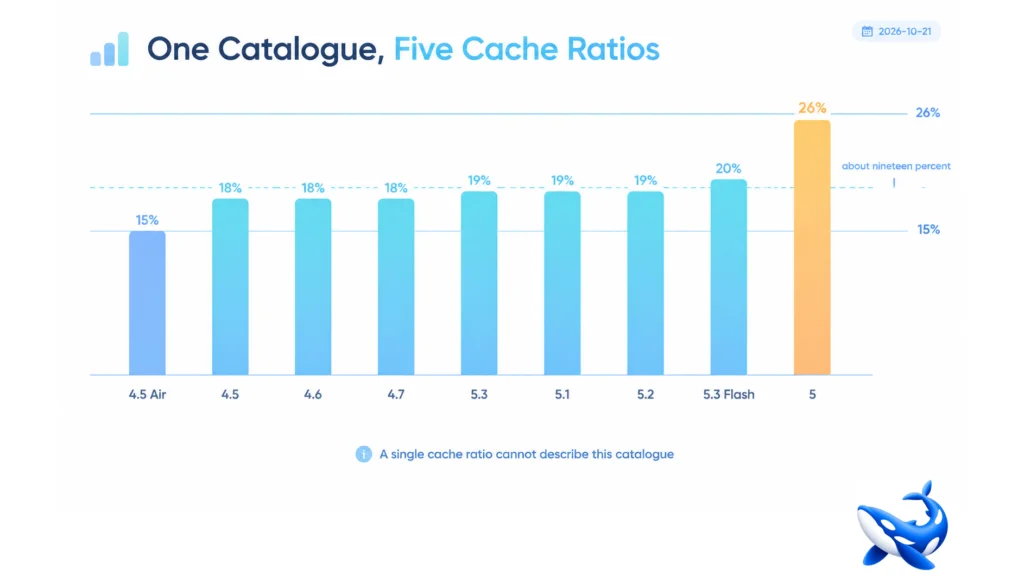
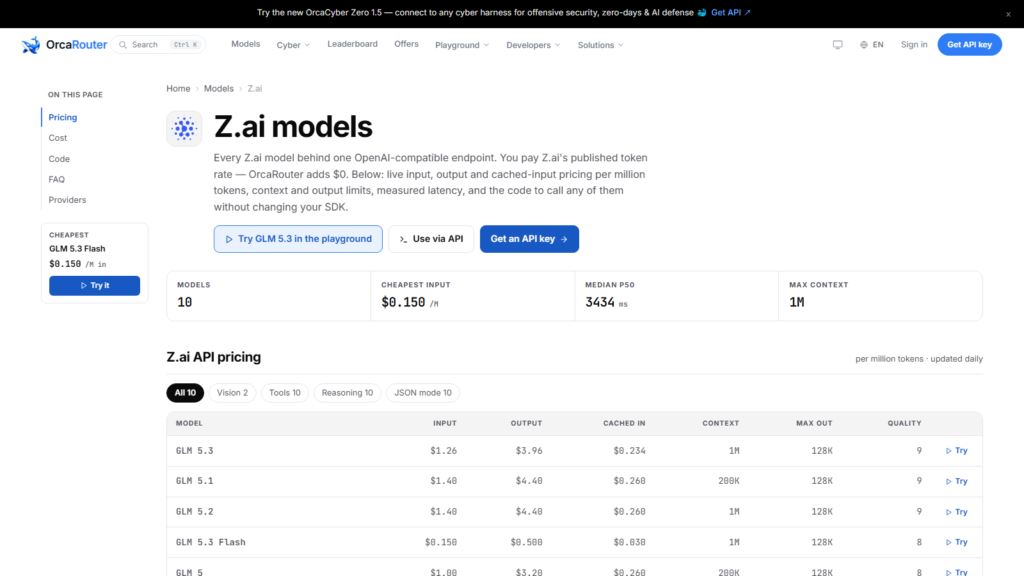
Most provider catalogues price cached input at one rate for all their models. The OrcaRouter z.ai api page does not: nine of its ten rows carry a cached-input price, and those nine sort into five distinct ratios to their own input rate [OURS arithmetic on VENDOR-published rates, read 2026-10-21].
The ratios run from 15.0 percent on GLM 4.5 Air to 26.0 percent on GLM 5, with three rows at 18.3, three at 18.6 and one at 20.0 filling the band between. That is a spread of 1.73× across a single catalogue — enough that a cost model carrying one number for cache is wrong by nearly three quarters on at least one row.
The ratio table
| Row | Input | Cached | Ratio | Output ÷ input |
| GLM 4.5 Air | $0.200 | $0.030 | 15.0 % | 5.50× |
| GLM 4.5 | $0.600 | $0.110 | 18.3 % | 3.67× |
| GLM 4.6 | $0.600 | $0.110 | 18.3 % | 3.67× |
| GLM 4.7 | $0.600 | $0.110 | 18.3 % | 3.67× |
| GLM 5.3 | $1.26 | $0.234 | 18.6 % | 3.14× |
| GLM 5.1 | $1.40 | $0.260 | 18.6 % | 3.14× |
| GLM 5.2 | $1.40 | $0.260 | 18.6 % | 3.14× |
| GLM 5.3 Flash | $0.150 | $0.030 | 20.0 % | 3.33× |
| GLM 5 | $1.00 | $0.260 | 26.0 % | 3.20× |
| GLM 5.3 Flash (Free) | $0.00 per request | — | — | — |
Read that table as five groups rather than ten rows: 15.0 percent on the cheapest row, 18.3 on the 4.x trio, 18.6 on the 5.x trio plus 5.3, 20.0 on 5.3 Flash, 26.0 on GLM 5.
The first thing to notice is that GLM 5, the row with the *highest* input price in the 18-percent cluster’s neighbourhood, is the row with the *shallowest* discount. Its cache hit costs $0.260 — the same absolute figure as GLM 5.1 and 5.2 — against an input rate of $1.00 rather than $1.40. Same cached price, lower input price, so a bigger share.
That is a useful illustration of why the ratio is not a policy statement. GLM 5.1, 5.2 and 5 have cached prices of $0.260, $0.260 and $0.260 respectively. The cache read costs the same on all three. What differs is the input rate beside it.
What the spread is worth in dollars
Take a workload with a 60,000-token prefix repeated a hundred thousand times a month — six billion cached tokens, a plausible shape for an agent with a long system prompt and tool schemas.
At 18.3 percent (the 4.x trio’s ratio), the cached rate is $0.110 and the monthly input line is 6,000M × $0.110 ÷ 1,000,000 = $660.00. At 26.0 percent (GLM 5), it is $0.260 and the line is $1,560.00. At 15.0 percent (GLM 4.5 Air), it is $0.030 and the line is $180.00 [OURS arithmetic].
The spread between the shallowest and the deepest ratio is 8.7× in absolute dollars, because the ratio and the input rate multiply. A reader comparing “18 percent versus 26 percent” sees a 1.44× difference in ratio; a reader comparing bills sees a difference eleven times larger, built from a ratio difference and an input-rate difference compounding in the same direction.
That is the arithmetic case for recomputing per row rather than carrying a provider-wide average. The average of those nine ratios is 19.3 percent, and 19.3 percent matches exactly zero rows.
The two rows that share a ratio but not a price
GLM 5.3 and GLM 5.1 both sit at 18.6 percent, and their input rates differ — $1.26 against $1.40.
A ratio-only comparison would call them equivalent. A bill comparison puts 5.3’s cached token at $0.234 against 5.1’s $0.260, a 10 percent difference that exists purely because the input rate differs by the same 10 percent.
This is the general rule the catalogue illustrates neatly: the ratio tells you the shape of the discount and the rate tells you its size. Two providers can offer the same percentage and wildly different dollars, and one provider can offer ten different percentages that all produce similar dollars.
The 4.x trio makes the same point from the other end. Three rows, identical input ($0.600), identical output ($2.20), identical cached price ($0.110) and identical ratios. The only columns that separate them are context window — 128K, 200K, 200K — and the quality score, 7, 7, 7. So the trio is one product at three model generations, priced as if nothing changed, which is how a mature tier behaves.
The one row whose price is not per million tokens
`GLM 5.3 Flash (Free)` bills $0.00 per request, and its row is shaped differently from the nine above it: the phrase occupies the input cell, the output and cached cells carry dashes, and the context and max-output values follow in the columns after.
It is the only row in the ten with no cache ratio, because there is no token rate for a cache ratio to be a share of. A per-request row has no prefix, no cache and no input/output split — the whole billing model is a different shape, which is exactly why the columns do not line up.
The page’s header statistic is the second half of this story. It reads Cheapest input $0.150/M, which is GLM 5.3 Flash’s rate, not the free row’s zero [OURS]. So the header’s cheapest figure excludes the free row — presumably because a per-request charge is not a per-million-token input rate — while the pricing table lists both side by side without saying so.
That is a small inconsistency with a practical consequence: a reader looking for the cheapest way to run a query gets a different answer depending on which part of the page they read. The table’s cheapest per-token row is $0.150; the table’s cheapest row overall is $0.00 per request; the header picks the first. All three are true, and none of them is labelled as a choice.
The capability profile sitting beside the price
One structural fact about this catalogue does not appear in the price columns at all, and it decides whether the price is even relevant to your workload.
Across all ten rows, Tools, Reasoning and JSON mode are 10 of 10, and Vision is 2 of 10 [OURS]. It is the most lopsided capability census of any provider on the site: every model supports tool calling and structured output, and almost none accepts an image.
For a text-and-tools workload that is excellent news — there is no row you have to exclude on capability grounds, so the choice is entirely about price, cache and context. For a multimodal workload it is the opposite: the catalogue offers two rows and the rest are disqualified regardless of how favourable their cache ratio looks.
The practical consequence for the cache arithmetic above is direct. The rows with the best ratios are not the same as the rows with the best capabilities, and on a two-of-ten vision catalogue that is a real constraint rather than a footnote. A workload that needs vision is choosing among two rows and paying whatever their cache ratio is; a workload that does not is choosing among ten and can optimise.
How to use a catalogue with five ratios
Three habits, all cheap.
Compute the ratio per row and keep the dollars. The percentage is a summary; $0.234 versus $0.260 is the number that appears on an invoice. Store both, because a comparison needs the percentage and a budget needs the price.
Check whether two rows share a cached price rather than a ratio. GLM 5.1, 5.2 and 5 all cache at $0.260. Their ratios differ from each other’s because their input rates differ. If your workload is prefix-heavy, the shared cached price is the number that matters, not the ratio.
Cross the capability census with the price columns. Ten of ten on tools and two of ten on vision means the price comparison is only meaningful within the two-of-ten subset for some workloads. Read the chips before you read the table.
A catalogue that prices cache differently on every row is not being inconsistent; it is pricing each model on its own terms. The cost model that survives it is the one that recomputes per row and never assumes a provider-wide number.
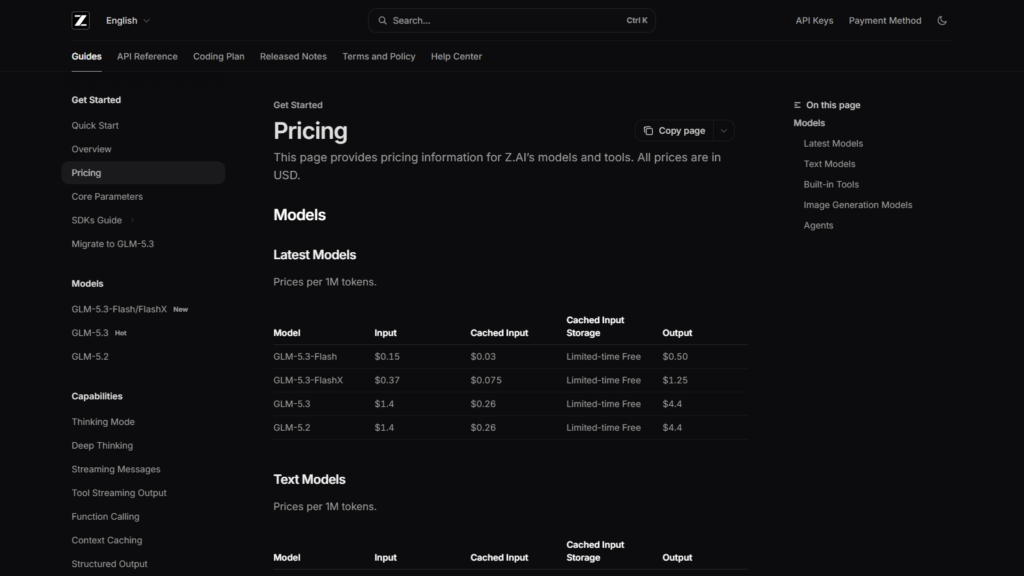
Sourcing note: every rate, cached-input price and ratio in this article is computed from the OrcaRouter Z.ai provider page read on 2026-10-21, where the rates are the provider’s published prices passed through with $0 markup [VENDOR]. The ten ratios, the monthly arithmetic, the capability counts and the header-versus-table comparison are ours [OURS]. The 0-to-10 quality scores, where mentioned, are our own composite, not a third-party benchmark. No third-party evaluation figures are used. Rates change; all values checked 2026-10-21.
















Leave a Reply